I’m thrilled to announce a significant upgrade to the Admissions Statistics on FilmSchool.org, a milestone made possible by our dedicated Supporting Members and the more than 5,000 entries logged in our application database.
We’ve introduced a suite of powerful new tools to both our application and program-specific pages, now including 45 charts that break down admission rates by undergraduate degree, age, re-applicant frequency, portfolio, and more. We’ve also added comprehensive interview data, highlighting common questions and admission rates based on performance. Most excitingly, our brand-new Scattergrams now allow you to visualize your chances of admission based on Film Experience and GPA. Since all of these new insights are made possible by crowd sourced data, I encourage everyone to log their own applications to help keep these insights accurate and helpful for all.
In order to fully utilize all of these new features, you need to be a Supporting Member. Prices will be increasing on 5/1 for new subscriptions so be sure to lock in the lower rates now.
Without further ado, here is a list of some of the new features and charts available to Supporting Members.

See exactly where your application stands in real time.
At the top of every application in our database (when GPA and Film Experience are entered), you’ll now see an interactive scattergram showing how that applicant compares to thousands of others for the same program.

These charts reveal powerful patterns and trends that help you understand what actually improves your chances and even give you a realistic picture of who would be in your cohort if accepted.
Below are real examples of the charts and insights you’ll gain as a Supporting Member.
NOTE: These example charts are drawn from actual stats across many different programs in our database.


Read more about all the new features here:
We’ve introduced a suite of powerful new tools to both our application and program-specific pages, now including 45 charts that break down admission rates by undergraduate degree, age, re-applicant frequency, portfolio, and more. We’ve also added comprehensive interview data, highlighting common questions and admission rates based on performance. Most excitingly, our brand-new Scattergrams now allow you to visualize your chances of admission based on Film Experience and GPA. Since all of these new insights are made possible by crowd sourced data, I encourage everyone to log their own applications to help keep these insights accurate and helpful for all.
In order to fully utilize all of these new features, you need to be a Supporting Member. Prices will be increasing on 5/1 for new subscriptions so be sure to lock in the lower rates now.
Without further ado, here is a list of some of the new features and charts available to Supporting Members.
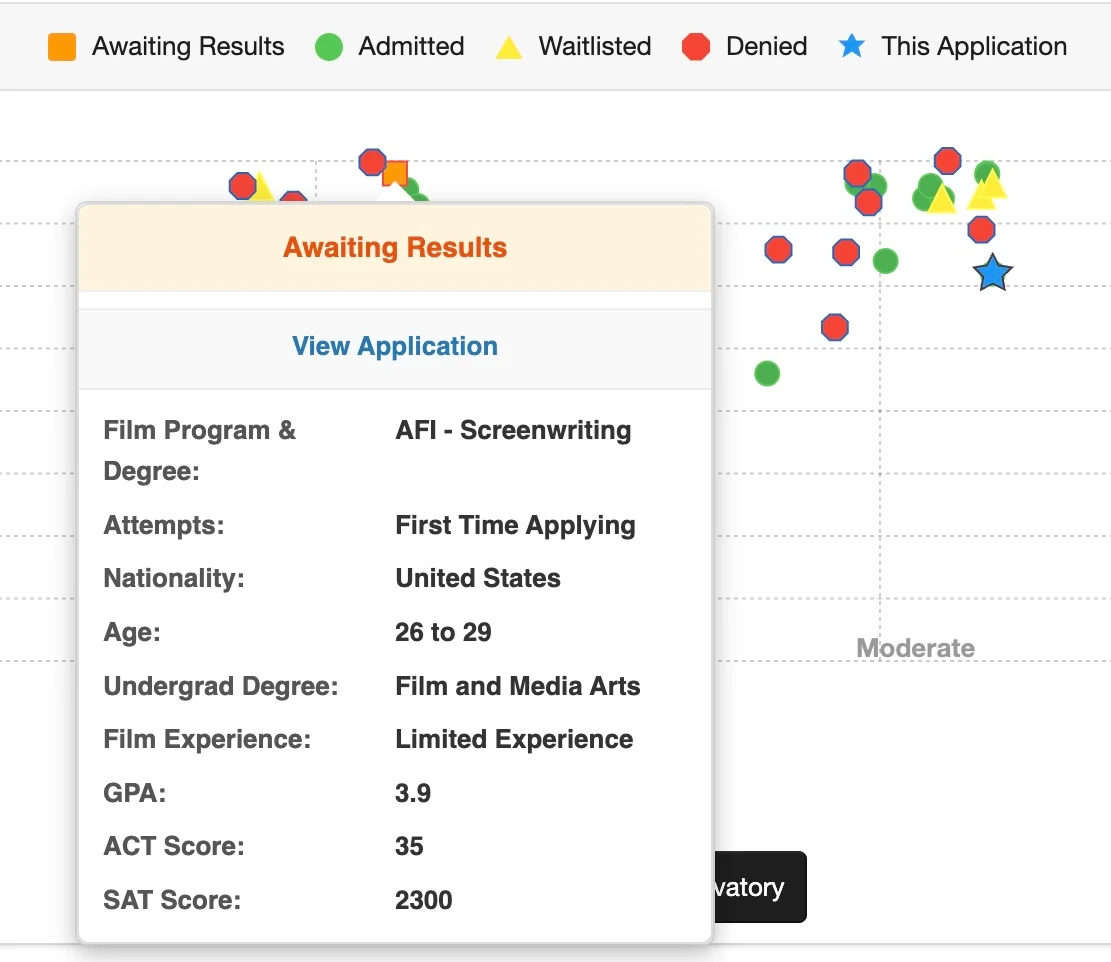
NEW This Application in the Scattergram
See exactly where your application stands in real time.
At the top of every application in our database (when GPA and Film Experience are entered), you’ll now see an interactive scattergram showing how that applicant compares to thousands of others for the same program.
- See applications plotted by GPA and Film Experience levels
- View their real outcomes: Admitted, Waitlisted, Denied, or Awaiting Results
- Hover over any icon for a quick popup with full application details
- Browse and explore all applications to a specific program visually
45 Charts of Exclusive Admissions Statistics
In addition to the new “This Application in the Scattergram” feature, Supporting Members get access to 45 exclusive charts built from real crowdsourced application data.These charts reveal powerful patterns and trends that help you understand what actually improves your chances and even give you a realistic picture of who would be in your cohort if accepted.
Below are real examples of the charts and insights you’ll gain as a Supporting Member.
NOTE: These example charts are drawn from actual stats across many different programs in our database.
Admittance Statistics of Application Attempt
Admittance Statistics by Undergrad Major
Admittance Statistics by Type of Film Experience
Admittance Statistics by Portfolio Film/Script Type
Admittance Statistics of Applicant by Feeling after Interview
Interview Topics Discussed
Read more about all the new features here:Help & How-To article 'Film School Unlocked: 45 Charts of Exclusive Admissions Data built from 5,000+ Real Applications - Supporting Members Only'
Do you want to know exactly what film school admissions departments are looking for?
Become a Supporting Member and unlock access to over 45 exclusive charts packed with real admissions data crowdsourced from 5,000+ applications in our database. You’ll also get exclusive bonus interviews with...
- Updated
- 3 min read
- Category: Application Database & Acceptance Statistics
A huge thank you to all of our Supporting Members! You are literally what makes this site and all these cool and helpful features possible.
Last edited:
")